This Bitcoin Price Pattern Suggests $5,800 Potential Ahead
Bitcoin is trending inside an ascending triangle pattern on the hourly chart that brings potential for a move to over $5,880, analysis suggests.
:format(webp)/cloudfront-us-east-1.images.arcpublishing.com/coindesk/45ZBSQCKXVEZNBE46A3V6FJA7I.jpg)
View
- Bitcoin has cemented a higher low and retained its bullish market structure on the daily chart after a hotly contested close on April 9.
- The hourly chart shows bitcoin is trending inside an ascending triangle (typically bullish by nature) with a potential measured move to $5,885.
- An exaggerated bullish divergence has formed on the hourly chart, providing additional weight to the likelihood of an imminent bullish breakout.
Bitcoin has managed to fend off any further attacks from the bears during April 9's tug-of-war trading session.
The cryptocurrency is now trading in a $100 range between $5,187 and $5,287 placing its price firmly above the prior April 4 low and cementing a higher low on the daily chart.
The hourly chart is also looking more favorable on the new daily trading period (April 10), with bullish momentum having maintained a hold above $5,200 support over the last 24-hours despite multiple dips in its price.
Bitcoin now looks set to continue its climb within the previously discussed ascending triangle – typically bullish indicators – with a measured target set at $5,885 should BTC break above the upper trendline at $5,320–$5,350.
Hourly chart
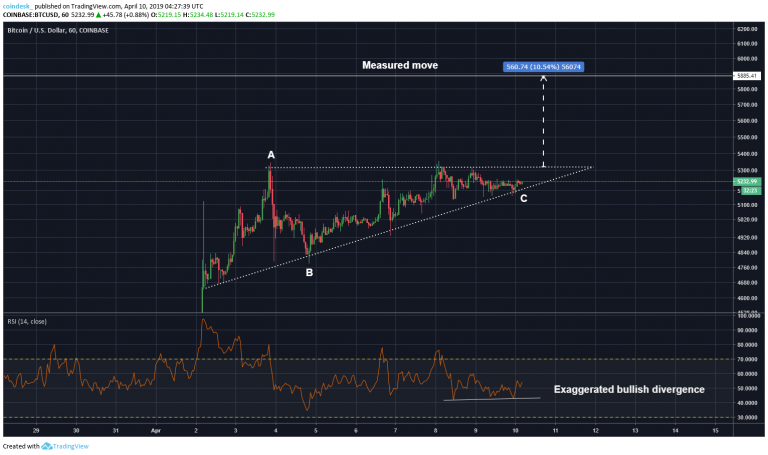
So how do we arrive at the $5,885 target? We can roughly calculate the potential move by measuring the height between A and B (the upper resistance line and the lowest drawdown in price within the pattern). That figure is then added to the upper resistance line above point C at the point of breakout, producing a new figure as a price target.
As can be seen, an exaggerated bullish divergence has also taken shape on the RSI, recorded from April 8–April 9, meaning a continuation in price is being supported additionally by the indicator on the hourly chart.
Daily chart
:format(webp)/cloudfront-us-east-1.images.arcpublishing.com/coindesk/WWBYP4GNARFQVCTPE3LBHPJKKY.png)
The daily chart shows the bulls maintained a higher low above April 4's red candle. That kept intact the bullish market structure above the key 100-period and 200-period moving averages yesterday, which are slowly beginning to converge for a bull cross.
Should those two lines cross bullish, then greater buying pressure would become the norm with a new bull run on the cards.
The RSI shows a divergence from price, printing lower lows while price continues to print higher lows, signaling greater bullish conditions ahead for the world's top crypto by market value.
Disclosure: The author holds no cryptocurrency at the time of writing.
Bitcoin image via Shutterstock; charts via TradingView
:format(webp)/downloads.coindesk.com/arc/failsafe/user/1x1.png)