:format(webp)/cloudfront-us-east-1.images.arcpublishing.com/coindesk/YW43SNFSXJH7HAHLV2A6IDSR5I.jpg)
Christopher Brookins is the founder of Valiendero Digital Assets, a quantitative crypto fund founded out of Carnegie Mellon.
------------------------------------------------------------------------------------------------
Since the end of 2018, price action has been demonstrably negative, which surprised many expecting the end of Q4 historical “pump” in prices.
Only recently, has price begun to rebound. Even so, RSI and SWTO are still trending downward (black arrows), which may point to further price weakness at the beginning of Q1 2019 while bitcoin searches for a sustainable bottom.
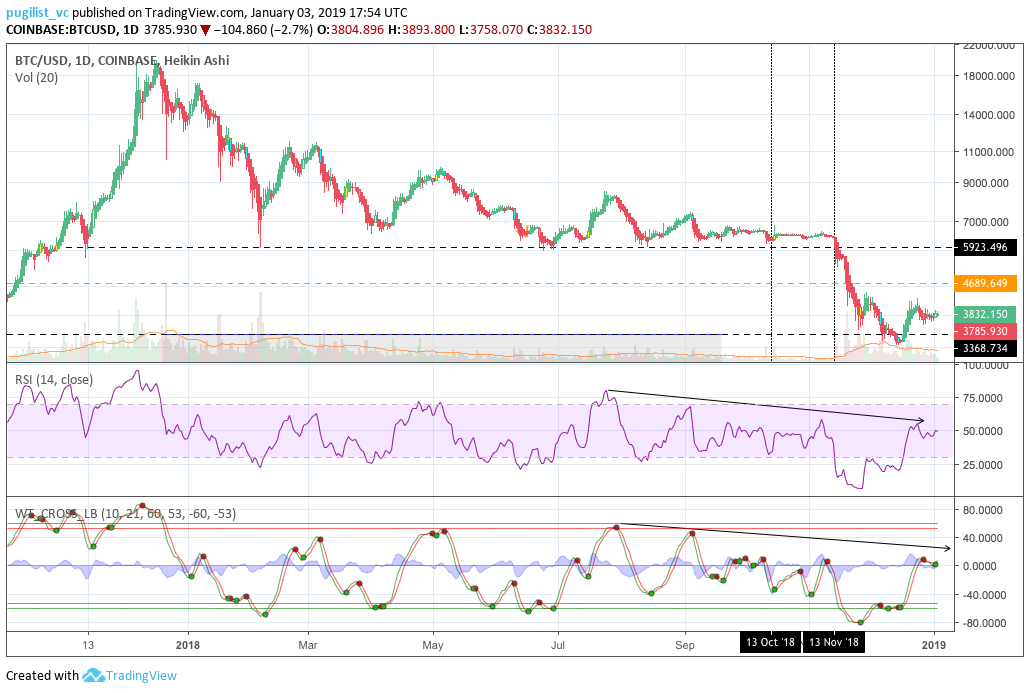
Charts via Tradingview.com
Volatility ≠ Price Growth
As mentioned prior, many market commentators and participants assumed, incorrectly, that Q4 was always a strong period for market price growth, specifically from mid-November to the end of December. However, what many viewed as historically consistent price growth during this period, was in fact historically consistent volatility growth.
The graphic below shows historical daily volatility trends of bitcoin on a yearly basis since 2013. Thus, the supposition that many bulls were wrongly betting on was that higher volatility always equates to higher prices.
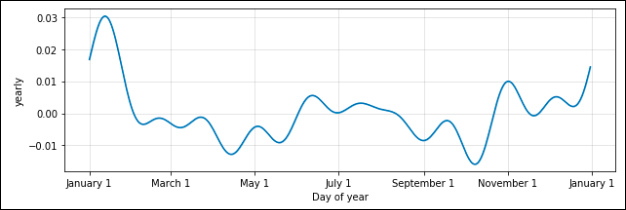
*Gdax/Coinbase Pro
As the volatility chart illustrates, the volatility trends of BTC, since 2013, do follow predictable patterns, culminating in higher volatility during Q4. This dynamic unfolded again in 2018 as price volatility compressed from October to mid-November (black lines), which typically precedes a breakout in price action. However, this time, volatility broke out to the downside for bitcoin.
After analyzing the overall trend in 2018 (demonstrably bearish), price volatility compression, historical volatility patterns, and fundamental indicators, it should have been more clear to market participants that the probability of a negative price breakout was far higher than to the upside.
Fundamental Indicators
Fundamental indicators can be quite useful for ascertaining a “narrative” of price movements and patterns, as long as the narrative is rooted in non-subjective data exploration. However, given the small sample size of bitcoin market cycles (n=10), each indicators output and predictive ability should be taken with a “grain of salt”.
Nic Carter from Castle Island Ventures / CoinMetrics and Antoine Le Calvez from Blockchain.info recently pioneered a new concept called realized cap (capitalization). The differentiation between realized cap and market cap being “instead of counting all of the mined coins at equal, current price, the UTXOs are aggregated and assigned a price based on the BTC/USD market price at the time when said UTXOs last moved."
David Puell and Murad Mahmudov do an excellent job explaining these terms and significance further in their article.
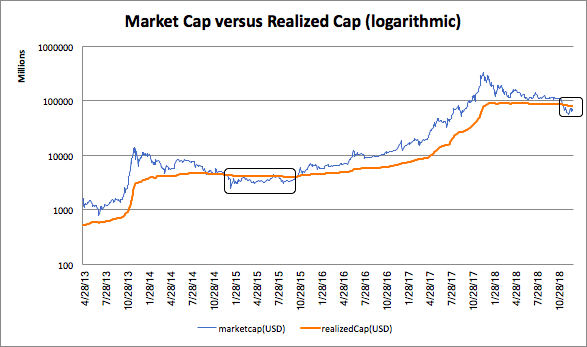
Using data from CoinMetrics, the significance of realized cap compared to market cap can be visualized quite dramatically, albeit via a small sample size. The crossover points between market cap and realized cap can be viewed almost similar to golden crosses, whereby market cap breaching above realized cap is a re-ignition of a bull cycle, while a cross beneath may indicate the final stretch of a bear cycle. Beyond the aforementioned, this comparison offers lessons which may bear out or "repeat" in 2019.
Looking at the graphic, market cap went beneath realized cap on December 28, 2014, and stayed beneath realized cap until October 28, 2015, which coincides with the data-validated, high volatility period for bitcoin.
In this case, volatility coincided with price growth for bitcoin and kicked off the start of an amazing two-year bull run for bitcoin. This time around, market cap fell beneath realized cap on November 20, 2018. So, if history repeats itself (which is a tepid assertion), an investor might expect further price declines in 2019 followed by sideways trading, until a reignition of a new bull cycle at the end of Q4 2019 (November to December 2019).
Correlation to Δprice of 0.19
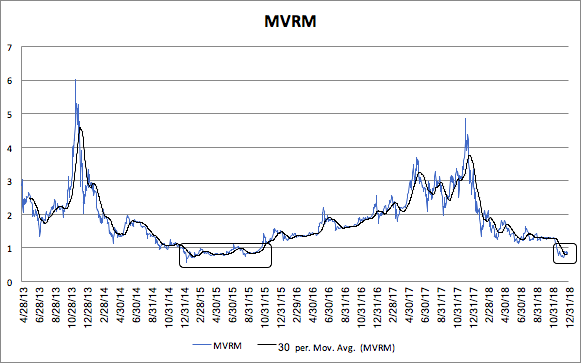
Additionally, using realized cap, an additional ratio or oscillator can be created that further explains bitcoin’s market cycles, market cap to realized cap (MVRM). The MVRM provides a useful indicator that visualizes the above dynamic via one ratio.
For example, historically, a value beneath 1.0 is undervalued while a value above 3.0 is overvalued; and above 4.0 is a negative inflection for prices. Currently, MVRM is 0.82 and the all-time low is 0.56. So, despite bitcoin being in undervalued territory, MVRM still possibly has further room to fall, which is consistent with the end of Q4 2019 narrative.
Further support of the significance of MVRM for price movements can be seen by the correlation between price and MVRM of 0.19, and correlation between price and MVRM of 0.98, which is extraordinarily high.
Network transaction volume to active addresses ratio (TAAR)
This ratio acts as an “equilibrium” gauge of bitcoin’s price to fundamentals valuation, where transaction volume and active addresses both represent "quantity and quality" growth of the bitcoin network; validated by 0.15 and 0.07 correlation between price, respectively.
For example, when TAAR and price are closely distributed, price (valuation) and fundamentals are aligned in equilibrium; and when either TAAR or price deviate substantially from each other, price is out of equilibrium which has historically resulted in price devaluation (albeit small sample size). The market’s recent selloff has helped reduce the gap between price and TAAR, which has persisted since Q4 2017.
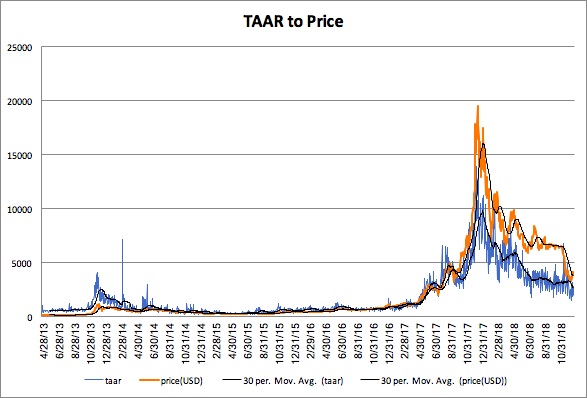
Correlation to Δprice of 0.13
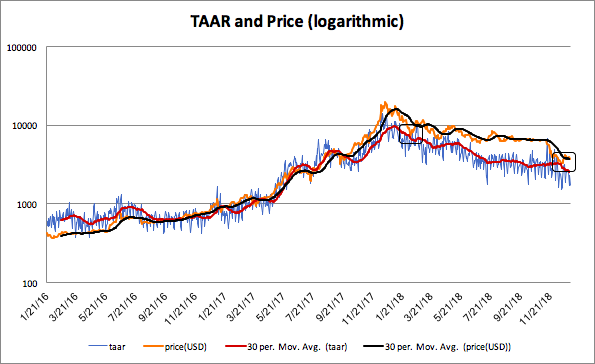
The 30 day moving average of TAAR is ~$2500 while TAAR daily is ~$2000, thus an “equilibrium” range for price appears between $2,000 and $3,000. *Note: prices seldom mean revert directly to their equilibrium level, they typically over-correct, which makes further price depreciation beyond the stated levels possible. Additionally, as can be seen on the logarithmic chart, price has bounced off TAAR’s 30-day MA twice in 2018 (black boxes), and has most recently rebounded momentarily.
The final price flush before finding a stable bottom will likely coincide with price falling beneath the TAAR 30 day MA, price recovering that level, and then TAAR beginning to trend upward once more.
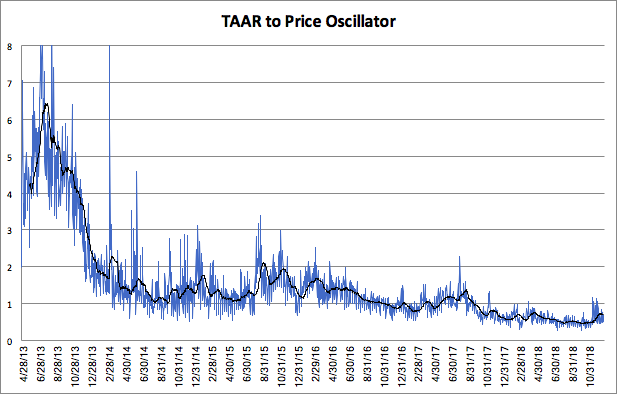
Similar to MVRM, the TAAR to price ratio is an oscillator that visualizes the same dynamic via one ratio. Historically, a ratio of 1.5 and above is undervalued, 1.0 to 2.0 is "safe", and beneath 1.0 (“equilibrium”) is overvalued. Currently, the oscillator is ~0.70 which still indicates overvaluation, but the overall trend back towards 1.0 is positive.
Conclusion
While the recent price action for bitcoin has been harshly negative, these market clearing events have begun the normalization process for bitcoin’s price valuation, which can be seen in several indicators. Per the MVRM analysis above, if history repeats itself, price will likely fall further, then trade sideways until the end of Q4, then reignite a new bull market.
An additional verification of this narrative will be if the TAAR to price oscillator enters undervalued territory above 1.50 in 2019, especially, prior to Q4.
*Disclaimer: this article is for educational purposes only and should not be considered investment or trading advice.
Bitcoin image via Shutterstock
:format(webp)/downloads.coindesk.com/arc/failsafe/user/1x1.png)