Bitcoin Price Leaps Resistance Hurdle in Weekend Breakout
Bitcoin’s breakout from $5,050 resistance has defied overbought indicators and set a new target of $5,550 for the bulls.
:format(webp)/downloads.coindesk.com/arc/failsafe/user/1x1.png)
:format(webp)/cloudfront-us-east-1.images.arcpublishing.com/coindesk/B2WKJMII75GYJOIWD66774CPRE.jpg)
/arc-photo-coindesk/arc2-prod/public/LXF2COBSKBCNHNRE3WTK2BZ7GE.png)
View
- Solid gains over the weekend saw bitcoin’s price rise $200/4.89 percent, defying overbought indicators on the daily chart with a strong candle close on April 7.
- The hourly chart for bitcoin is printing an ascending triangle, signalling a continuation in price action.
- The longer-term outlook remains bullish for bitcoin as long as prices stay above the prior daily candle close at $5,193.
Bitcoin’s breakout from $5,050 resistance has defied overbought indicators and set a new target of around $5,550 for the bulls.
Bitcoin (BTC) rose 4.89 percent during the weekend period beginning April 6, a move that added another $233 to its price tag. At press time, the cryptocurrency is changing hands at around $5,248 according to CoinDesk's Bitcoin Price Index.
Looking ahead, there's potential for continuation of the bullish trend given that investors will likely be seeking to add to their current positions in case prices cross above a local wick high of around $5,350.
Given that the total market capitalization has just reached a 5-month high, the odds are rising that bitcoin could once more enter a long-term bull market in the coming months.
Daily chart
:format(webp)/cloudfront-us-east-1.images.arcpublishing.com/coindesk/5FVZRIIXPBG4VAOB6WPFDFOLKI.png)
The daily chart shows a bullish market structure began to take shape on Dec. 16, 2018, with a series of significant higher lows and now – thanks to the April 2 breakout from the ascending triangle – a significant higher high above the 200-daily moving average (DMA).
The daily RSI continues to post overbought conditions, but investors are unlikely to pay much heed for fear of missing out on bitcoin’s next potential jump to $5,557 weekly resistance.
Hourly chart
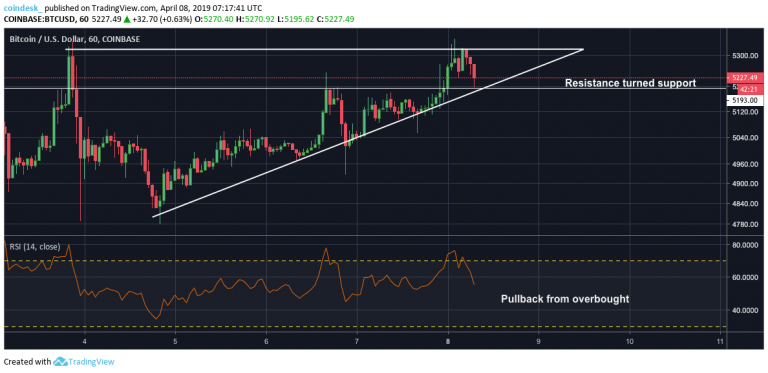
The hourly chart presents a bullish case in the form of an ascending triangle measured from two resistance points at around $5,345 and $5,350.
While prices have pulled back slightly, footing has been found above former resistance levels now turned support – a bullish sign indeed.
If BTC can maintain a close above $5,200, that would add considerable weight for a continuation in bitcoin’s price.
Disclosure: The author holds no cryptocurrency at the time of writing.
Bitcoin image via Shutterstock; charts via Tradingview